<!doctype html>
<html lang="en">
<head>
<meta charset="UTF-8">
<title>Help</title>
<link rel="stylesheet" type="text/css" href="plotHelpStyle.css">
</head>

<body>
<h2>Instructions on How to Generate Plots</h2>
In addition to selecting a pre-configured plot from the "Open a plot from cloud storage"
menu, you can also drag a .csv file onto the indicated panel to create a new plot.
<br><br>
The .csv file is expected to consist of multiple lines of data, with fields separated by commas.
The first field in each record is interpreted as an "X" value.
Other fields on each record to the right of that are interpreted as "Y" data, for one or more curves.
<br><br>
Here's a simple example of a .csv file that contains X and Y data which define a single curve.
<br><br>
<div class="csvData1">
<pre> 
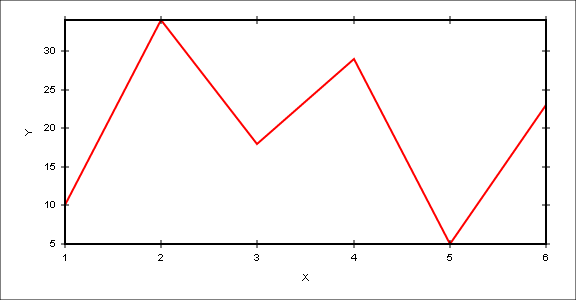
1,10
 2,34
 3,18
 4,29
 5,5
 6,23</pre></div>
<br>
After dragging & dropping this .csv file, the following plot was generated:
<br><br>
<img src="samplePlot1.png" alt="simple plot" width=650>
<br><br>
Here's how date/time data for the X axis is currently supported.  Date/time data can be expressed
as the number of milliseconds since January 1, 1970.  If the data in the first column of a .csv file
are all greater than 315532800000 (which corresponds to January 1, 1980), then the X data is
interpreted as representing date/time values.
<br><br>
Here's an example of a .csv file which records some measurements taken at various times.
<br><br>
<div class="csvData2">
<pre> 
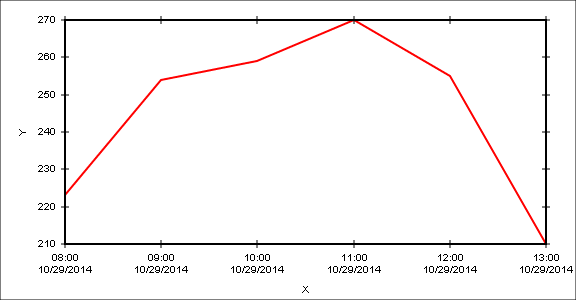
1414584000000,223
 1414587600000,254
 1414591200000,259
 1414594800000,270
 1414598400000,255
 1414602000000,210</pre></div>
<br>
After dragging & dropping this .csv file, the following plot was generated:
<br><br>
<img src="samplePlot2.png" alt="plot with a date/time X axis" width=650>
<br><br>
Alternatively, the date/time values in the first field can be expressed as a string containing 19 characters.
Below is an example of a .csv file which uses a supported date/time format.
(Note: the delimiters between date/time fields can be anything, but a 4-digit year must be in position 0-3,
a 2-digit month must be in position 5-6, a 2-digit day in position 8-9, a 2-digit hour in position 11-12,
a 2-digit minute in position 14-15, and a 2-digit second in position 17-18).

<br><br>
<div class="csvData3">
<pre> 2024/11/24 15:46:00,254
 2024/11/24 15:47:00,230
 2024/11/24 15:48:00,270
 2024/11/24 15:49:00,260
 2024/11/24 15:50:00,210</pre></div>
<br>
Here's how to plot multiple curves, in which some of them consist of sparse data.
In the example below, we want to plot two curves of data which are sampled on an hourly basis.
In addition, we want to plot another curve which is defined by two points that are sampled
at different times than the rest of the data.  To accomodate this, the .csv file should have a '~' character in locations
where there is no applicable data.  See the example below.
<br><br>
<div class="csvData4">
<pre> 
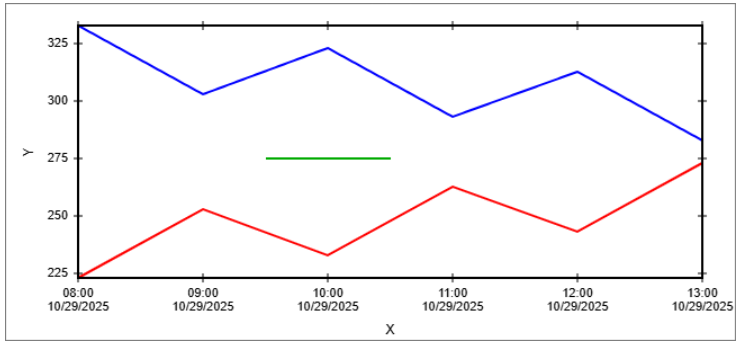
2025/10/29 08:00:00,223,333,~
 2025/10/29 09:00:00,253,303,~
 2025/10/29 09:30:00,~,~,275
 2025/10/29 10:00:00,233,323,~
 2025/10/29 10:30:00,~,~,275
 2025/10/29 11:00:00,263,293,~
 2025/10/29 12:00:00,243,313,~
 2025/10/29 13:00:00,273,283,~</pre></div>
<br>
This data was used to generate the following plot:
<br><br>
<img src="samplePlot3.png" alt="plot with multiple curves" width=650>
<br><br>
<h2>Customizing the Appearance of a Plot</h2>
Use the various controls under the Canvas, Axes, Tick Marks, Curves, Legend, and
Annotations tabs to configure how you'd like the plot to appear.
Here is an example of how the Axes tab is supposed to appear.
<br><br>
<img src="axesTab.png" alt="contents of the Axes tab">
<br><br>
<h2>Saving a plot</h2>
Use the Save tab to save your customized plot to cloud storage.  Plots are stored in an XML format with a file type of ".plot".
<br>
<br>
For additional information, contact <a href="mailto:john.ewing.1000@gmail.com">John Ewing</a>.
</body>
</html>